1.1.0 Motivation
The following topical coverage is typical in most introductory probability classes: sample space, random variables, expectation, conditional probability, independence, discrete and continuous distributions (with several brand-name random variables), Law of Large Number, Central Limit Theorem, and estimation theory. They constitute the core focus of such classes. While this set of topics is absolutely essential to quantify uncertainties, this core focus highlights mathematical constructs and lacks motivation (the "why"). The following framing of "why", "what", and "how" of probabilistic analysis sets the stage for the orientation of this book.
Why?
Because we want to
What (to do)?
What (to do with the completed model)?
How?
More detailed elaboration of the 3 W's and 1 H framework appears next.
1.1.1 Probability and Probabilistic Analysis
These two statements capture the 3 W's 1 H spirit. Firstly, it is our curiosity to make sense of life's unpredictability that we desire to study probability (the "why"). This unpredictability has two components: the set of possibilities (or outcomes: sample space characterization, not necessarily numerical) and their associated likelihoods (probability assignment)-- which specify a complete probability model (the first "what" to structure and build a probability model). An axiomatic approach (the Axioms of Probability Theory) prescribes a rigorous structure governing these two components to build a mathematical probability model (part of the "how" to create the fundamental principles).
Various derived principles, definitions and metrics are created to extract maximum utility from a completed mathematical probability model (the second "what"). These derived quantities provide clarity to communicate uncertainties and very often help guide a decision process. Rules and procedures are necessary to ensure the consistent processing of available probabilistic information to compute the desired quantities (the "how"). Structuring and presentation of probabilistic information is an art, while processing probabilistic information is mechanical. Nevertheless, they are equally important.
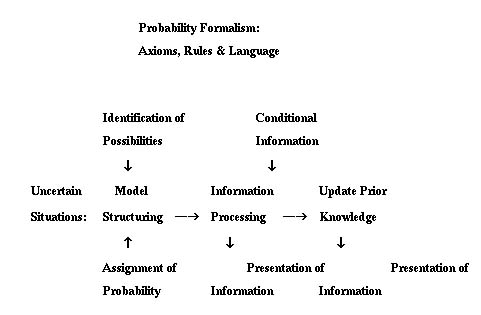
Probabilistic analysis is then the process to transform available probabilistic information into the most useful and relevant format for the decision problem at hand:
The following schematic illustrates the process of probabilistic
analysis:
There are many "compartmental" examples in this text to illustrate concepts, definitions and techniques. By nature (of being compartmental), they are limited in scope. But they serve their purposes. We identify the many "other" real life comprehensive examples by their contextual names to highlight the problem context. These examples show the abundance of interesting probability problems in everyday life. Many examples in this text originated from student projects submitted as probabilistic awareness exercises. The benefit is: students become curious about probability problems and they set out to model them. When they talk to their friends and family about probability, the teacher will know she's done something right.
Our intent is to stimulate your interest in probabilistic analysis
with the many lively examples. They are fun and many of them
are real. If these examples inspire you, you may actively seek
to model and solve important probability problems.
1.1.2 Strategic Intent
Our goal is to build formal mathematical models to make
sense of uncertainties. If we think hard enough, common sense
and logic will carry us a long way. Any logical inconsistency
and apparent paradox can be resolved on a case by case basis --
but this is not a preferred scientific approach. I once heard
the following parable from the late Professor Bill Linvill:
I went to a locked house with unknown treasures inside. The coal
chute is its only entrance. I went down the chute, making a mess
of myself. The house was in bad repair, dirty and cluttered.
I systematically cleaned it up, discovering and polishing many
hidden treasures to highlight their unique beauty. In doing so,
I constructed a theme tying together many seemingly disconnected
parts -- they all now make perfect sense. To share my labor,
I unlocked the door to invite many a visitor. The house lay-out
is now clear, uncluttered and tells a story -- out of which visitors
still discover, frame and construct stories of their own. However,
they do not have to go through what I went through -- they can
work with the structure I created and do many more creative and
interesting things.
Now that I have gone through the house of probability, my strategic
intent is for you to tell many more interesting and creative stories.
There are obviously many ways to arrange this house. We have
chosen one to facilitate probabilistic analysis, which is how
this text is written and organized. The rules, tools and language
are provided to assist and not to obscure. This is how we have
chosen to show you our house: The tour of our house starts with
motivation to show you the abundance of interesting stories to
be made sensible after the house tour. The rules of the house
are introduced as a necessity to provide consistency and clarity.
The tools are chosen to be transparent, easy to use and versatile.
The tour of the house provides a map to help you create your
own stories.
1.1.3 Creating and Telling Your Stories: Spreadsheet, Trees and Probability Clinics
The tools (analytical techniques and mathematics), the models building and the presentations are the means to perform probabilistic analysis. While it is pleasing to provide an elegant closed form solution, we do not seek this as an end. If an analytical solution is attainable, we will provide it. A spreadsheet program provides the perfect complement (not substitute) to analytical techniques in probabilistic analysis. It is supplemental in numerical situations, and indispensable in sensitivity analysis. In programming a spreadsheet computational procedure, it often demands a more thorough understanding of the formula as well as probabilistic reasoning. We choose spreadsheet as a programming tool because it requires minimum learning over-head and it is readily available. Using spreadsheet, probability concepts become instantly protable from the classroom to many practical real world problems. The use of spreadsheet is evident in the many tables constructed to provide additional insight in problem sensitivity. Many statistical problems with table look-up can be accomplished with ready spreadsheet "paste functions". You are rewarded with careful problem set-up and not tedious table look-up. In fact, all the tables (normal, chi-square, student t) in this text are constructed with a spreadsheet program. An appendix contains simple instruction to use these functions.
We use probability trees extensively throughout the text: it gives a clear lay-of-the-land configuration to highlight the two components of a probability model: identification of outcomes and the assignment of probabilities. A probability tree provides visual clarity to effectively use conditional information. The process of "flipping" a probability tree is more transparent than using set and event algebra manipulations: they provide the same analytical conclusions. Do not be fooled by its simplicity: it works and it works well.
Graphs and schematics are used sparingly throughout the text.
They are invaluable to communicate model structure (input and
output interaction), intermediate computational logic, and visual
representation of computed outputs.
What are Probability Clinics and Why?
Conducting Probability Clinics is our way to bridge the proficiency in the mechanics of probabilistic analysis to actually modeling and solving real world problems. Excellence in the mechanics of manipulating probabilistic quantities does not necessarily translate into the ability to frame a real world problem. The mechanical nature of text book type problems does not help to stimulate student interest beyond the classroom environment.
A Probability Clinic is similar to a case study of sort.
Each clinic will cover selected topics as follow-ups to many
of the examples in the text. They are comprehensive in nature
and touch upon many concepts, techniques and modeling skill.
They are structured to achieve the following objectives:
We bring our tool bag to complete a project, not a hammer to
look for a nail.
As a student of probability, it is also your responsibility to
educate the public to be probability literate, to be critical
of what you read and what you see. You will soon discover that
probability is often misunderstood and misused. We do not ask
you to be a probability patrol police, we ask you to educate and
make a difference. The following newspaper excerpt appeared on
September 12, 1995 in the San Francisco Chronicle. This table
accompanied an article on the Bosnia conflict when the United
Nations authorized the use of Tomahawk land attack missile. The
probabilistic statement here makes absolutely no sense. Can you
find out what it means?
Ship-launched cruise missiles are capable of hitting distant
targets with either a nuclear or conventional high-explosive warhead
with great precision. The new Block 3 version has a 30 percent
increase in range.
1.2 Having Fun with Probability
The following examples, hopefully, will wet your appetite for wanting to know more about probabilistic analysis. They are all covered in the text.
1.2.1 How Lucky do You Feel? Hope and Fear at the Luggage Carousel
One of the (unavoidable) unpleasant chore of modern convenience is the waiting of your luggage after a long flight. Most people have two conflicting feelings: hope and fear. Given that you are still waiting, your hope of seeing your luggage next initially goes up (the next one has to be mine, I have been here long enough). After a while, the possibility that they messed up becomes a real concern: your hope (that the next piece is yours) starts coming down. On the other hand, your fear that they have lost your luggage is ever increasing the longer you wait. Are your hope and fear rational and real? We will build a model to examine the rationality (or the lack thereof) of your emotion.
1.2.2 The O.J. Trial: a Brilliant Defense or an Irrational Jury
Beyond a reasonable doubt is a personal (and subjective) notion. Did the defense do a good job in casting reasonable doubt on the jurors' minds, or that the jury is irrational in reaching a not-guilty verdict (even in the presence of a very strong DNA evidence)? This problem scenario is structured to quantify many intuitive notions of evidence, strength of evidence and attack on evidence. It can eventually lead to a resource allocation problem: how to get most bang for your bucks for both the prosecution and defense.
1.2.3 Whose Birthday is it?
There are n students in your probability class, what is the probability that at least two people have the same birthday (month and day only)? The art of probabilistic analysis is to abstract a problem into an appropriate mathematical model. Many probability problems share the same mathematical structure. We will show that this birthday problem has the same structure as flavored varieties on an ice cream cone.
1.2.4 Tissues Typing and Kidney Transplant: a Racially Biased Policy?
It is a policy decision to establish rules to assign donated kidneys to waiting recipients. Various issues have been raised as to how best to manage the matching between available organs to waiting recipients. Interested readers can consult articles in The Washington Post, January 31, 1991 and The Wall Street Journal, April 1, 1993.
The followings are observed facts : (1) black patients have
a much longer waiting time for their needed organs, (2) white
Americans have a very different organ profile (in terms of the
probability of presence of each of the ten antigens) than an African
American, (3) the organ donor pool consists of roughly 90% white.
One of the donor-recipient matching rules is tissue typing: it
is to minimize the number of antigen mis-matches. Simultaneous
presence or absence of each antigen (in a donor-recipient pair)
is considered a match. It has been charged that tissue typing
is racially biased (because of the composition of the donor pool:
10% black), thus leading to long waiting time for black Americans.
The following chart contrasts the antigen profiles for black,
white and the donor pool. Is tissue typing the real culprit?
The answer may surprise you.
1.2.5 The Load on the Golden Gate Bridge
In 1987, the Golden Gate Bridge (in the San Francisco area) celebrated its 50th anniversary (not birthday, as I was told by the authority). The city closed the bridge from traffic and allowed pedestrians to walk across. It was such an attraction that the span of the bridge actually sagged and worried many a civil engineer. It was not built to support that kind of "sea of people" load. How can we use probabilistic analysis to model the effect of uncertain load on a bridge?
1.2.6 Election Poll
What does the following statement mean: " The margin of error for our poll is ± 5 percentage point." Are we absolutely sure that if the fraction (who support our candidate) in the poll is 46%, the true underlying fraction is in the range [0.41, 0.51]? The answer is: not quite and that the statement does not really make sense without further qualification. Probabilistic analysis helps us to articulate what this statement means by providing a suitable structure.
1.2.7 Supply and Demand Equilibrium
When the market price (of a product) is right, supply equals demand and the market clears. The exact supply and demand equilibrium occurs at the interaction of the supply and the demand curves. Uncertainty in the supply and demand curves (modeled as uncertainty in parameters) results in the uncertainty of the equilibrium price and quantities. We examined this implied uncertainty in the supply and demand equilibrium.
1.2.8 Putting on the Correct Label
Products from the same manufacturing process are often sold under different labels because of non-uniform product quality. A different label can mean different price, different warranty and possible different guarantee product life. How can we use an imperfect test to infer product quality so that the "optimal" label can be attached on each product?
1.2.9 Cornering the Lotto Market
Is it worth the cost and risk to buy all the combinations of a lottery game when the accumulated jackpot reaches a certain level? What is the logistics involved in such an undertaking?
1.2.10 Modeling HIV Transmission
What is the risk of contracting HIV in a heterosexual relationship? How does behavior (random partners or monogamous relationship) affect the chance of contracting this virus?
1.2.11 Ask Marilyn
The following articles appeared in the Ask Marilyn column
in Parade Magazine, which accompanies many local Sunday
newspapers. The probability problems in this column are quite
entertaining. To be probability literate, students of probability
should be able to provide clarity to these questions, build mathematical
models, as well as compute the answers. The answers given by
Marilyn are often correct (with the exception of one). Her correct
answer to item #1 generated an onslaught of responses from the
readers and was even picked up by the Operations Research and
Management Sciences community in a running commentary in the OR/MS
TODAY magazine. We will cover this and many others in Chapter
Three.
1.2.12 Math is Against Warriors
The above headline appeared in the Sports Section of the San
Francisco Chronicle in 1993 just before the NBA annual draft lottery.
The NBA draft lottery works as follows:
The Chronicle article produced a draft-position odds chart, prepared by a team of physics professors at the University of Texas-Arlington, which was generated by a Monte Carlo computer simulation of 1 million lottery draws. It shows that the probabilities that the Warriors will end up with a first, second or third draft pick are, respectively, 7.58%, 7.96%, and 8.42%.
Our question is: with such a simple structure as the NBA draft lottery, do we need to perform simulation to determine the odds? How may one use simple probabilistic analysis to carry out the computations?
The NBA subsequently changed the lottery rule in 1994. In 1995,
two expansion teams were assigned specific draft positions in
the draft lottery. We will analyze these changes all with a spreadsheet
model.
1.2.13 Pour and Score with Tropicana and the NFLTM
It's Tropicana's new twist to NFL football, and playing is easy. Simply cut the Official Game Piece below along the dotted lines to form a notch at the top as shown. Then flip the game piece, and the notch will point to the NFL city or team award that you've put into play. Collect several game pieces and match to win.
Match a city from one carton and a team from another (like "Chicago" and Bears") and win one of 300,000 limited edition NFL caps with Tropicana logo on back.
How attractive is this promotion to you?
1.2.14 Spinning Wheel of Fortune
1.2.15 Ninety-Nine Percent?
The following description is found in a magic book:
Have the deck shuffled thoroughly. Do not use a new pack or one that has just been used in a game. You need a good shuffle. Place the pack on the table and announce: " I will ask you to name two cards-- just the values, not the suits. I shall attempt to place the two cards together in the pack by a snap of my fingers. What are your choices?" (For example: a Seven and a King.) Snap your fingers above the deck and add, " If I miss they will be no more than a single card apart."
Start to deal the cards one at a time, face up, until you hit
the two cards which will be together (or within a single card
apart) ninety-nine percent of the time. If you don't see the
cards together immediately, don't despair, deal out the rest of
the deck. The cards called should not be in immediate sequence,
such as a Six and Seven. You can add, "Make the difference
greater," although it works with sequence cards most
of the time. Try it yourself. It is fun.
Do you believe in the above assertion? Can you use probabilistic analysis either to prove or disprove this 99% claim?
1.2.16 Of an Absent Person Presumed Dead
Define an absent person as someone of whom it is not known where
he is and whether he is alive. After a certain time of absence,
the person may be presumed dead by order of the court. Legal
declaration of death allows the court to settle the estate. How
can probabilistic analysis be used to provide a quantitative guideline
for the jurists?
This question was addressed by Nicholas Bernoulli (1687-1759)
in his thesis De Usu Artis Conjectandi in Jure (The Use
of the Art of Conjecturing in Law), published in 1709. Bernoulli
proposed to use probability theory and Graunt's life table to
solve this problem. John Graunt (1620-1674) was the son of a
London Draper. Graunt analyzed the weekly reports on vital numerical
data of mortality for the parishes of London, with the publication
of his book Natural and Political Observations Made Upon the
Bills of Mortality in 1662. His life table was the first
descriptive statistical analysis of such data. Graunt's method
of analysis was also extended to economic data.
1.2.17 Guilty or not Guilty
In 1964 in Los Angeles a woman with blond colored hair in a ponytail snatched a purse from another woman. The thief fled on foot but was later spotted entering a yellow car driven by an African American man with a beard and a mustache. Police investigation eventually focused in on a woman with blond colored hair in a ponytail who regularly associated with a bearded and mustachioed African American man who owned a yellow car. There wasn't any hard evidence linking the couple to the crime, or any witnesses able to identify either party. There was, however, agreement on the above facts.
The prosecutor argued that the probability was so low that such a couple existed that the police investigation must have turned up the actual perpetrators. He assigned the following probabilities to the characteristics in question: yellow car: 1/10; a man with a mustache: 1/4; a woman with a ponytail: 1/10; a woman with blond hair: 1/3; an African American man with a beard: 1/10; an interracial couple in a car: 1/1000. The prosecutor further argued that the characteristics were independent, so that the probability that a randomly selected couple would have all of them would be
(1/10) (1/4) (1/10) (1/3) (1/10) (1/1000) = 1/ 12,000,000
a number so low that the couple must be guilty. The jury convicted
them.
Act as a juror and decide whether you would vote guilty or not. We will discuss this case and its extension in some details in Chapter 7.
1.2.18 A Game of Non-Concentration
You do not need to think playing this game (the thinking is done
before hand!!). A deck of 40 cards (in 20 pairs) are laid out
faced down. How many cards should you turn over so that exactly
m matched pairs are revealed? Would you participate in this game
for even money if you can pick m (# of matched pairs) and the
number of cards drawn-- you can choose an m between 6 and 13 (inclusive)?
1.3 Chapter Summary and a Road Map
We conclude most of the examples with a summary of our findings to illustrate the "art" of information presentation: what is most helpful to the decision maker? There are several summary tables and relationship charts providing ready references to many important results and concepts: Bernoulli-Poisson families relationship chart (Chapter 9); Discrete Brand Name Random Variables relationship Chart (Chapter 9) and similar chart for continuous Random Name Random Variables; summary table for concepts and definition with random variables (end of text); and a summary table with most of the often used random variables (end of text). The use of spreadsheet is evident in the many examples with computational components as well as sensitivity considerations. Its use is to complement and extend analytical derivation, and not to replace it.
Chapter 2 examines systems with equally likely outcomes, which represent the initial focus of probability theory: the analysis of games of chances. The use of counting to account for various possibilities is an essential analytical tool in such systems, which leads us to the topic of combinatoric analysis. The extent of coverage in combinatorics stops with simple counting: simple permutation and combination. More complicated counting is accomplished through the use of recursions (dynamic/difference equations). The most important lesson in these recursive equations is the identification of relevant states so that one can relate them recursively. The use of recursions will be formalized as the concept of conditioning to solve many probability problems.
Chapter 3 starts with many examples highlighting the two components of a probability model: the identification of outcomes and the assignment of probabilities. The axioms of probability theory is introduced as an articulation of our common sense and as a guide to handle more complex problems (where our common sense may fail). It also introduces the concept of conditioning (perhaps the most important concept in probability). The conditioning concept is useful in the systematic assignment of probabilities (when a model is built) and in the processing of new information to update the original model. The construction and "flipping" of a probability tree is introduced. We advise the readers to develop competence and thorough understanding of tree building and tree flipping.
Chapter 4 contains lively examples to demonstrate model building as well as analytical mechanics, where probability trees are extensively used. Two concepts will be introduced: the use of recursion (difference equations) and the concept of re-generation. Several examples introduced in Chapter 1 will be solved, as are some problems related to medicine.
Chapter 5 introduces a convenient and powerful way to represent uncertain outcomes: the concept of a random variables. This chapter focuses on probabilistic situations where the outcomes and countable using discrete random variables. The usual concepts and definitions are introduced with many examples: assignment of probability (Probability Mass Function, PMF), conditional probability, joint PMF, marginal and conditional PMF, as well as derived distribution (or change of variables).
Chapter 6 examines probabilistic situations with continuous outcome representations, the concept of continuous random variables. Parallel concepts are examined: Probability Density Function (PDF), joint PDF, marginal and conditional PDF. The concepts are identical (to the discrete case) with continuous mathematics (calculus) replacing discrete book-keeping. A Lie Detector Test example demonstrates the flipping of a mixed (discrete as well as continuous) probability tree.
Chapter 7 provides a separate treatment on change of variables (or derived distribution) for continuous random variables. The distribution of a random variable is derived from that of another known random variables, where these two random variables are functionally related. We treat this topic in a separate chapter because the continuous mathematics become slightly more complicated. Nevertheless, if the rules of calculus are observed carefully, the conceptual construct is rather straightforward. An economic supply and demand equilibrium is examined to model the probabilistic variation in the price-quantity equilibrium due to other underlying uncertainties.
Chapter 8 examines the concept of expectation, which we view as the weighted (by probability masses or probability density) sum (or integral) of a particular metric (or consequence) of interest. This procedure will be referred to as "conditioning" and "unconditioning". The act of conditioning evaluates the metric of interest given particular conditional information. The act of "unconditioning" assigns the appropriate weights (or probability measure) to various conditional outcomes and sum (or integrate) them. Expectation is often used to provide a summary of a probabilistic situation, useful as metric for a decision problem.
Chapter 9 contains a collection of brand name random variables, with their distributions and special properties. The Bernoulli family of random variables is contrasted with the Poisson family of random variables. Two relationship charts are constructed to relate many of the parametrized brand name random variables, one for discrete and one for continuous.
Chapter 10 highlights the importance of clarity in the structuring of probabilistic problems: what does randomness mean and where does it originate? The precise identification of the source of uncertainty is necessary to avoid ambiguity, ambiguity that may draw different conclusions. The examples in this chapter also provide ample opportunities to demonstrate many aspects of "change of variables".
Chapter 11 gives a brief introduction to moment generating functions, or transforms. Their inclusion is for completeness of topics as a first course in probability as well as its application to prove a Central Limit Theorem in Chapter 12. At this level of probabilistic analysis, transform is considered as an alternative to obtain certain probabilistic information (e.g., summarizing functions for random variables). This chapter can be skipped with no loss of continuity.
Chapter 12 starts with a "knowledge" spectrum chart to show the use of limit theorems: from total lack of information, to knowledge of mean and variance to full knowledge of the distribution, and from a single observation of a random variable to repeat sampling of independent observations. This knowledge spectrum chart motivates the readers to the usefulness of these limit theorems. The examples we use in this chapter highlight sensitivity analysis and the use of spread sheet to explore the central limit theorem parametrically. An entertaining example modeling your emotional state while waiting for your flight bag at the luggage carousel is created to show the power of modeling and the use of spreadsheet to provide ready insight.
Chapter 13 provides a brief tour of estimation theory, from point estimate to interval estimates. Spreadsheet examples are given to demonstrate sensitivity analysis.
Chapter 14 and Chapter 15 show the abundance of probability problems in everyday life. These problems can be effectively used in Probability Clinics as as well as (often times) popular class demonstrations.
A Road Map
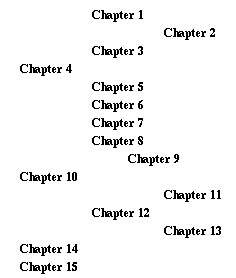
The following table depicts the logical progression of this text.
The middle column (with seven chapters) contains important concepts,
language, and tools for a rigorous first course in probabilistic
analysis. The left column (with four chapters) provides motivations
to demonstrate the need for formal mathematical modeling in order
to make sense of daily encountered situations. Most of them make
lively class presentations and demonstrations with a simple spreadsheet
model. Students often actively participate in class discussions
with these problems of general interest (and curiosity). They
also give students idea to model probabilistic situations as class
projects. Chapter 9 lies somewhere between the middle column
and the right column. This chapter deals mostly with mechanics
of manipulating several brand name random variables and it can
be selectively covered. The sections dealing with the Bernoulli
and the Poisson family of random variables provide an introduction
to stochastic process modeling. The right column (with three
chapters) can be skipped without loss of continuity, if time constraint
is an issue.
This text is designed to cover concepts in an introductory probability course with many useful protable tools, as well as lively examples to provide modelling framework (and process). It also serves well as a reference for many brand name random variables and how these random variables relate to each other.
Exercises
The exercises in this chapter are of the thinking and discussion
types, since we have not yet introduced any framework for processing
probability information. The readers are asked to think about
these questions, to make sense of them, to discuss with classmates,
friends and family. The objective is to heighten probabilistic
awareness and to be critical of what we see and read. Some of
the problems stated are intentionally vague--as they appeared
in their reported form. If they are vague (ill defined, unstructured),
provide the suitable structure so that they make sense, or that
you can proceed with reasonable analysis.
(1) Make sense of the table on Tomahawk Land Attack Missile.
You may want to consult the original source in Jane's, a military
weaponry related magazine.
(2) Comment on the "single-engine, twin-engine" problem
in problem (9) of Section 1.3.2. In particular, would a twin-engine
plane be built under such assumption.
(3) Comment on the answer given by Marilyn to the "diner"
problem (Section 1.3.2, problem (9)):
And now let's say that Gerald and Betty have lunch there twice
a week too. Their chances of seeing Jimmy and Rosalynn would
double again, to 4-in-7. That's a 57% chance. But you say that
Gerald and Betty see Jimmy and Rosalynn about 57% of the time.
So, because we know that Gerald and Betty only have lunch at
the cafeteria twice a week, we also know that Jimmy and Rosalynn
must go there more often than that, probably because they like
to stop food fights.
(5) If the odds are in favor of something happening -- as in "a
70% chance of rain" -- and it does not happen, does that
mean that the odds are wrong? ( Ask Marilyn, May 7, 1995
)
(6) Accident statistics are sometimes measured in accident rate
per unit distance traveled. If the accident rate on a stretch
of a road is 10-3 per mile and you will travel on this road for
5000 miles, what fate awaits you? In particular, how should you
interpret such accident statistics? We will examine this problem
in later chapters.
(7) In a medical decision analysis journal article, disease transition rate is calculated as follows: n subjects participate in a medical study. In a period of t years, k of the n subjects made a transition from health state x to health state y. The transition rate, r, from state x to state y is computed as: r = . r is interpreted as the transition rate per person per year. Try to understand the method and comment on its appropriateness. We will examine this problem in later chapters.
(8) In earthquake prone California, the following earthquake prediction
is frequently made: there is an 80% chance that an earthquake
of magnitude 8 or higher on the Richter scale will occur in the
next 15 years. What does it mean? What can one say about the
chance of a major quake (of magnitude 8 or higher) in the next
5, 10, 20 or 30 years? What model is being used in issuing the
prediction statement?
(9) " This dam is constructed to withstand a 50-year flood."
What does it mean?
(10) In a court of law, the following statements are frequently made:
What do they mean to you? How should a juror interpret such
instructions from a judge?
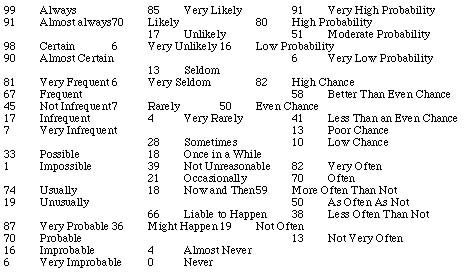
(11) Quantifying Probability Expression: How Likely is Likely?
Frederick Mosteller of Harvard University compiled the mean estimates
of science writers of their quantitative implications when using
verbal probability expressions. We are reproducing Professor
Mosteller's research results in the following table. Give it
some thoughts and see if they agree with your estimates. These
mean estimates are expressed in percents.
(12) After a certain medical treatment (for example, chemotherapy
for cancer), the condition is declared to be in remission if it
does not reappear after 3 years (for example). What does it mean?
(13) When you decide not to feed the parking meter, what is the
appropriate input(s) to your decision problem?
(14) The average driver will experience one accident every five
years. How does this statistic apply to you? What else would
you like to know in making an insurance purchase decision?
(15) Two people are asked by a third person to guess a number
between one and 10. Whoever gets closer to the number chosen
by the third person wins. Does the first or the second guesser
have the advantage? (Ask Marilyn, 6/25/95)